Call Spread on VIX on 8/20/2012

VIX is a trademarked ticker symbol for the Chicago BoardOptions Exchange Market Volatility Index, a popular measure of the implied volatility of S&P 500 index options. Often referred to as the fear index or the fear gauge, it represents one measure of the market's expectation of stock market volatility over the next 30 day period.
In February2006, CBOE launched VIX options, the most successful new product in Exchange history.In less than five years, the combined trading activity in VIX options and futures has grownto more than 100,000 contracts per day.

The negative correlation of volatility to stock market returns is well documented and suggests a diversification benefit to including volatility in an investment portfolio. VIX futures and options are designed to deliver pure volatility exposure in a single, efficient package.  

Stockwinners.com is bullish on Vix for the following reasons:

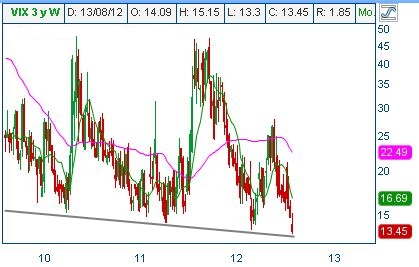
  1. Seasonality factor suggests that VIX tends to Surge during fall. The trend normally starts late August and continues through late October. VIX just made a 5 year low on Friday and is expected to bounce back from its current levels to its 50 day moving average around $22.45 due to mean reversion. It is important to note that every time Vix touches support line, it bounces back to its 50 day moving average.
  2. Bernanke might not hint the next QE during next FOMC meeting on Sep13th but market seems to be already discounting that.  Unsolved problems in Europe and trouble in Middle East and rising oil prices can also elevate VIX from its current level.
  3. The trade has a very wide range to be profitable and offers a great risk/reward ratio of 1:4. The idea here is to exit the trade before the expiration for a modest profit.

Trade: Buy 1 SEPT $20/$23 Call spread for less than $.60

  • Buy 1 SEPT $20 call for $1.50
  • Sell 1 SEPT $23 call for $ .90

Breakeven & profit analysis

Breakeven at $20.60 By Sept Expiration

Profit up to $2.40 between $20.60 and $23, max profit $2.40 above $23

Losses up to $.60 between $20.60 and $20, max loss $.60 below $20

The payoff table is presented below:

Trade

  • Buy 1 September $20.00 Call at $1.50
  • Sell 1 September $23.00 Call at $0.90
  • For a net debit of $0.60

Profit/Loss Analysis

  • Breakeven at $20.60
  • Maximum profit is $240.00 at strike of $23.00
  • Maximum loss is ($60.00) at strike of $20.00

Closing Summary

  • Sold 1 September $20.00 Call at $0.00
  • Bought 1 September $23.00 Call at $0.00

Position closed on 9/22/2012 at price of $0.00 with a -100.00% loss in 33 days.

Updates

9/21/2012 8:00:00 PM

This position expired on Friday 21st of September 2012.

Back to Portfolio