Put Spread on TWTR on 7/15/2014
 Twitter, Inc. (TWTR) is a global platform for public self-expression and conversation in real time.
It provides various products for users, including Twitter that allows users to express themselves and create, distribute, and discover content; Vine, a mobile application available on the iOS, Android, and Windows operating systems that enables users to create and distribute short looping videos; and #Music, a mobile application that helps users discover new music and artists based on Tweets. The company also provides a set of tools, public APIs, and embeddable widgets that developers can use to contribute their content to its platform; distribute Twitter content across their properties; and enhance their Websites and applications with Twitter content.
In addition, Twitter, Inc. offers promoted products, including promoted tweets, promoted accounts, and promoted trends that enable its advertisers to promote their brands, products, and services; and provides subscription access to its data feed for data partners.
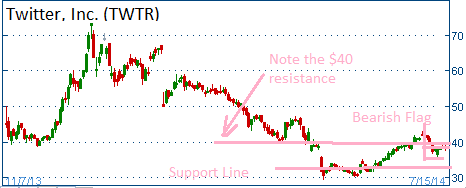
Shares began trading publicaly last Fall. The post IPO euophria pushed shares to a high of $74.73. Since then shares have began their descent. It appreats the the $40 level is an overhead resistance for the shares while the $30 level seems to be a floor.
The firm reports its results on or about July 22.
| Trailing P/E (ttm, intraday): |
N/A |
| Forward P/E (fye Dec 31, 2015): |
146.46 |
| PEG Ratio (5 yr expected): |
6.95 |
| Price/Sales (ttm): |
27.93 |
| Price/Book (mrq): |
7.62 |
| Enterprise Value/Revenue (ttm): |
25.47 |
| Enterprise Value/EBITDA (ttm): |
-33.10 |
|
| Fiscal Year |
| Most Recent Quarter (mrq): |
Mar 31, 2014 |
|
| Profitability |
| Profit Margin (ttm): |
-93.71% |
| Operating Margin (ttm): |
-92.54% |
|
| Management Effectiveness |
| Return on Assets (ttm): |
-21.53% |
| Return on Equity (ttm): |
-41.02% |
|
52-Week Trading Range: $29.51 - $74.73
Last Trade: $38.00
Here is the trade:
Trade
- Buy 1 August $38.00 Put at $2.85
- Sell 1 August $34.00 Put at $1.10
- For a net debit of $1.75
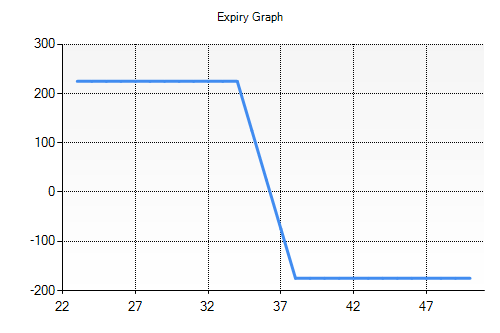
Profit/Loss Analysis
- Breakeven at $36.25
- Maximum profit is $225.00 at strike of $34.00
- Maximum loss is ($175.00) at strike of $38.00
Closing Summary
- Sold 1 August $38.00 Put at $0.00
- Bought 1 August $34.00 Put at $0.00
|
|
Position closed on 8/16/2014 at price of $0.00 with a -100.00% loss in 31 days.

